
Getting Started with Rust on a Raspberry Pi Pico (Part 3)
Iterating even faster by flashing and debugging with Visual Studio Code


This is the third and final installment of a series of guides exploring the use of Rust on the Raspberry Pi Pico. In this guide, I’ll show you how to make your embedded Rust development process even easier through the use of the Visual Studio Code to develop, compile, flash and debug all without ever leaving your favorite development environment.
Part 1 of the series - blinking an LED from a Pico
Part 2 of the series - iterating faster with cargo run
Review from Last Time
In the second guide in this series, I showed you how to use cargo run to make your embedded development cycle much quicker. And just like the last guide built on top of a much more manual process for compiling/flashing/debugging with the Pico, this one builds on the previous guide even more. Visual Studio Code, or VS Code, is a tremendous contribution by Microsoft to the software development community. Through an extensive plugin system, it truly can be the perfect development environment for just about anything.
Installing Prerequisites
In order to get started using VS Code for all of your Pico development, you’ll need to install two extensions. Open up VS Code’s Quick Open (CNTRL+P or CMD+P) and paste the following to install the Cortex-Debug and the Rust Lang extensions:
ext install marus25.cortex-debug
ext install rust-lang.rust
Cortex-Debug handles interfacing of VS Code and OpenOCD. Rust Lang brings first class Rust support such as providing lints, code completion and navigation, formatting and implements the $rustc problemMatcher that I’ll cover shortly.
Compiling an Example Application
Although you’re probably most interested in being able to debug Rust applications with ease on the Pico from the VS Code interface, it’s also very helpful to be able to compile your embedded Rust application from it as well.
To be able to do that, we first need to create a .vscode directory and tasks.json file within it, like so:
$ mkdir ~/Projects/rp2040-project-template/.vscodeWithin VS Code, add the ~/Projects/rp2040-project-template directory that we started to work with from the first guide to a new project. If you need to clone this source repository again, you may do so from this link.
Next, create a new file under the .vscode directory called tasks.json. Copy and paste this source listing into that file and save it:
{
    // See https://go.microsoft.com/fwlink/?LinkId=733558
    // for the documentation about the tasks.json format
    "version": "2.0.0",
    "tasks": [
        {
            "label": "Cargo build",
            "type": "shell",
            "command": "cargo",
            "args": ["build"],
            "problemMatcher": [
                "$rustc"
            ],
            "group": "build"
        },
        {
            "label": "Build binary",
            "type": "shell",
            "command": "arm-none-eabi-objcopy",
            "args": [
                "--output-target", "binary",
                # Reads from an ELF binary file
                "./target/thumbv6m-none-eabi/debug/rp2040-project-template",
                # Outputs a raw binary file
                "./target/thumbv6m-none-eabi/debug/rp2040-project-template.bin"],
            "problemMatcher": [
                "$rustc"
            ],
            "group": {
                "kind": "build",
                "isDefault": true
            },
            "dependsOn": "Cargo build"
        }
    ]
}
This sets up a build task called “Build binary” for your current VS Code workspace that instructs VS Code to execute the familiar cargo build. It’s a fairly straightforward task config, but if you have any questions or run into issues, feel free to leave a question at the bottom of this guide as a comment.
Let’s try this out. From VS Code, run the “Build binary” build task by navigating to Terminal→Run Build Task… or by pressing CNTRL+SHIFT+B on Linux or CMD+SHIFT+B on macOS.

You should see output similar to the following in the terminal pane below your source code:
> Executing task in folder rp2040-project-template: cargo build <

    Updating crates.io index
    Updating git repository `https://github.com/rp-rs/rp2040-boot2-rs`
    Updating git repository `https://github.com/rp-rs/rp-hal`
    Updating git repository `https://github.com/rp-rs/pio-rs.git`
  Downloaded paste v1.0.6
  Downloaded syn v1.0.82
  Downloaded rp2040-pac v0.2.0
  Downloaded cortex-m-rt v0.7.1
  Downloaded 4 crates (824.4 KB) in 1.40s
   Compiling autocfg v1.0.1
   Compiling proc-macro2 v1.0.32
   Compiling unicode-xid v0.2.2
   Compiling syn v1.0.82
   Compiling cortex-m v0.7.3
...
   Compiling pio v0.1.0 (https://github.com/rp-rs/pio-rs.git?branch=main#5b249bda)
   Compiling rp2040-hal v0.3.0 (https://github.com/rp-rs/rp-hal?branch=main#f68f148d)
    Finished dev [optimized + debuginfo] target(s) in 1m 20s
Flashing your Application to the Pico
Now we get to the interesting part of flashing our example embedded Rust application to the target Pico device (Pico B). To do that, we’ll need to create another VS Code-specific file called launch.json. Create it under the .vscode directory called launch.json.
Copy and paste this source listing into that file and then save it:
{
    // Use IntelliSense to learn about possible attributes.
    // Hover to view descriptions of existing attributes.
    // For more information, visit: https://go.microsoft.com/fwlink/?linkid=830387
    "version": "0.2.0",
    "configurations": [
        {
            "name": "Debug rp2040-project-template",
            "request": "launch",
            "type": "cortex-debug",
            "cwd": "${workspaceRoot}",
            "executable": "${workspaceFolder}/target/thumbv6m-none-eabi/debug/rp2040-project-template",
            "preLaunchTask": "Build binary",
            "servertype": "external",
            // This may need to be gdb-multiarch depending on your system (i.e. Linux vs Mac)
            "gdbPath" : "arm-none-eabi-gdb",
            // Connect to an already running OpenOCD instance
            "gdbTarget": "localhost:3333",
            // If you have the Pico SDK installed, allows the
            // display of the RP2040 CPU registers in VS Code
            "svdFile": "${env:PICO_SDK_PATH}/src/rp2040/hardware_regs/rp2040.svd",
            "runToMain": true,
            "preLaunchCommands": [
                "monitor init",
                "monitor reset init",
                "monitor halt",
            ],
            // Work around for stopping at main on restart
            "postRestartCommands": [
                "break main",
                "continue"
            ],
        }
    ]
}
Some things to note about this config:
The
preLaunchTaskwill ensure your Rust source code is freshly compiled using the other task config intasks.json.If you have the Pico SDK installed, make sure that you export the full path to where you placed it in the
PICO_SDK_PATHenvironment variable. This is typically done via your command shell’s config file like.zshrcor.bashrc. You may also copy this file from the SDK into your workspace for convenience. Keeping thesvdFileline uncommented if you do have the SDK, which will enable you to view the current values stored in the RP2040 CPU registers.The
preLaunchCommandsare instructions specifically for OpenOCD to make sure our target Pico is fully reset before flashing commences.
Debugging your Application
Make sure your Picoprobe setup from the first guide in this series is plugged in to your development machine and ensure OpenOCD is also running in your terminal like so:
$ src/openocd -f interface/picoprobe.cfg -f target/rp2040.cfg -s tclAt this point, you should be able to start debugging your application from within VS Code. To do so, click the menu item Run→Start Debugging or press F5.

You should see a debug console display pane below your source code with output that looks similar to the following:
Launching GDB: "arm-none-eabi-gdb" "-q" "--interpreter=mi2"
"/Users/jhodapp/Projects/rp2040-project-template/target/thumbv6m-none-eabi/debug/rp2040-project-template"Set "showDevDebugOutput": true in your "launch.json" to see verbose GDB transactions here. Helpful to debug issues or report problems
Reading symbols from /Users/jhodapp/Projects/rp2040-project-template/target/thumbv6m-none-eabi/debug/rp2040-project-template...
Program stopped, probably due to a reset and/or halt issued by debugger
target halted due to debug-request, current mode: Thread
xPSR: 0xf1000000 pc: 0x000000ee msp: 0x20041f00
target halted due to debug-request, current mode: Thread
xPSR: 0xf1000000 pc: 0x000000ee msp: 0x20041f00
target halted due to debug-request, current mode: Thread
xPSR: 0xf1000000 pc: 0x000000ee msp: 0x20041f00
target halted due to debug-request, current mode: Thread
xPSR: 0xf1000000 pc: 0x000000ee msp: 0x20041f00
target halted due to debug-request, current mode: Thread
xPSR: 0xf1000000 pc: 0x000000ee msp: 0x20041f00
target halted due to debug-request, current mode: Thread
xPSR: 0xf1000000 pc: 0x000000ee msp: 0x20041f00
Note: automatically using hardware breakpoints for read-only addresses.
target halted due to debug-request, current mode: Thread
xPSR: 0x01000000 pc: 0x00000178 msp: 0x20041f00
target halted due to debug-request, current mode: Thread
xPSR: 0xf1000000 pc: 0x000000ee msp: 0x20041f00
Note: automatically using hardware breakpoints for read-only addresses.
target halted due to debug-request, current mode: Thread
xPSR: 0x01000000 pc: 0x00000178 msp: 0x20041f00
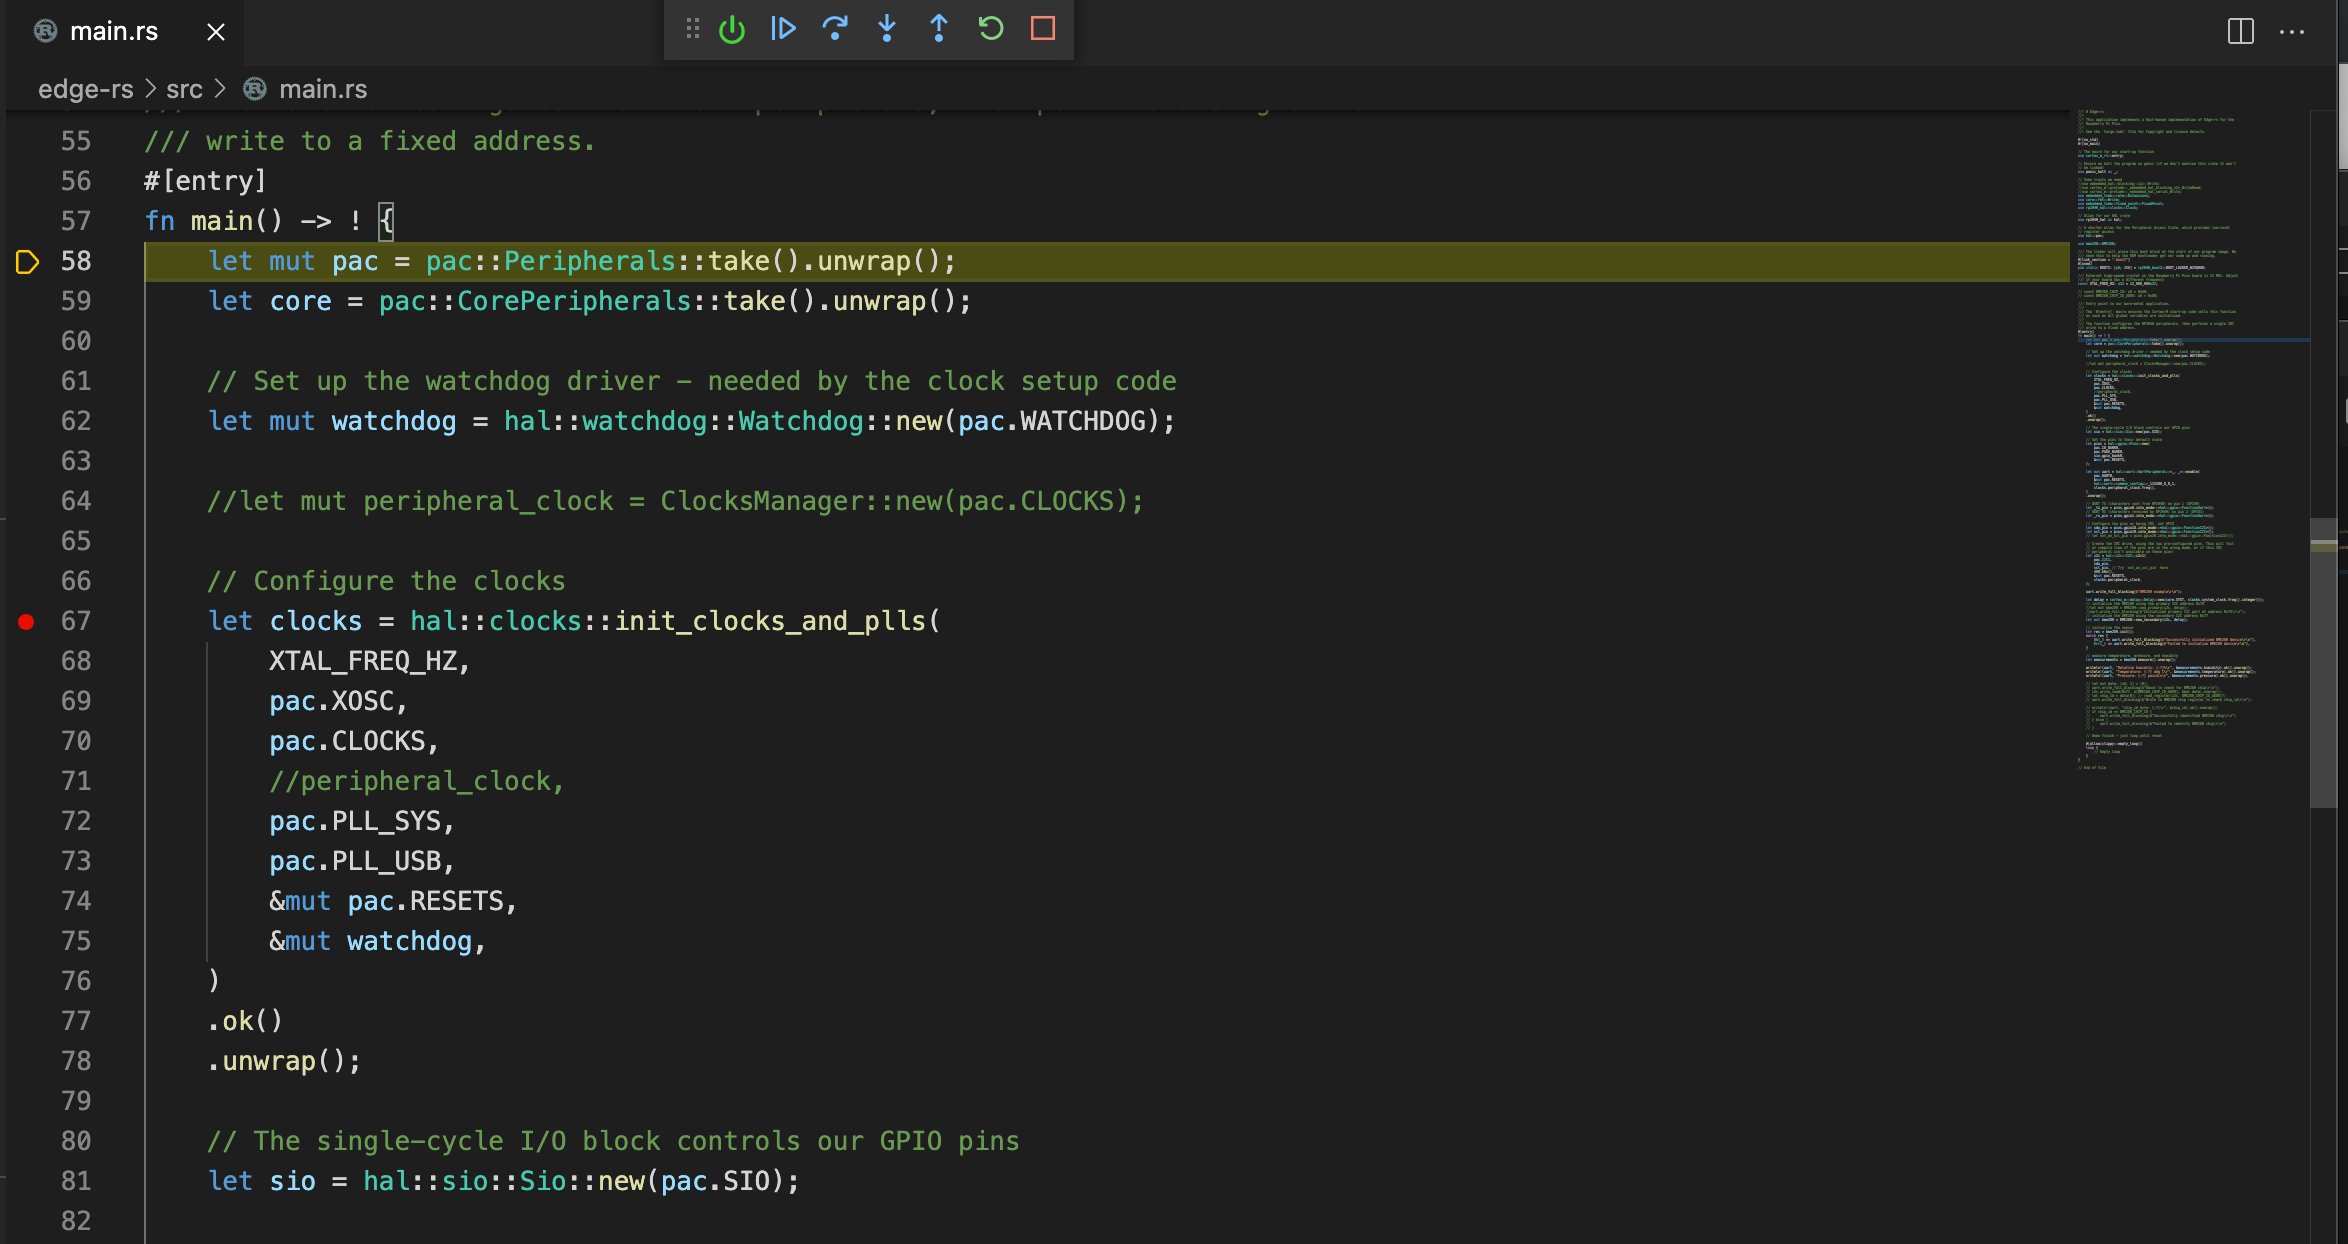
Thread 1 hit Temporary breakpoint 1, rp2040-project-template::__cortex_m_rt_main_trampoline () at src/main.rs:26Notice that the values contained in the CPU’s registers are displayed.
At the top center of the VS Code application you’ll see traditional debugging UI elements appear that look like:

Here’s a quick overview of what each button does (from left to right):
The first button (green) resets your Pico device and the example application you flashed onto it
The second button continues execution after it was paused manually or from setting a breakpoint
The third button executes the current line of code highlighted in the source editor and everything that it calls - it does not step you through all of the lower level code in a function or a chain of functions called
The fourth button works similarly to the third except it steps you through all code including function calls into the standard Rust libraries
The fifth button steps out of the current chain of functions back up to the root level
The sixth button restarts execution from
main()The seventh button stops debugging, disconnects from the target Pico, and returns you to the source code editor
Setting a Breakpoint
If you want execution to stop on a certain line of your Rust code, you may click in the area just to the left of the line number of a certain line of code that you’re interested in examining the behavior of.
You may set a breakpoint whether you’re currently running your application or not.
At this point, you’re well on your way to an easy-to-use development and debugging experience for the Pico in Rust!
Conclusion
This completes this particular guide as well as the current series of guides on getting started with Rust development on a Raspberry Pi Pico. If you’d like me to cover any additional topics related to Rust development on the Pico, please leave a comment below and let me know. Also, if you find any issues in any of these guides, leave a comment and I’ll be sure to correct them.
I hope these guides are helpful for you and give you some confidence to start building amazing things in Rust on your Pico! Feel free to reach out if you need any assistance in getting started - I’m more than happy to help give some pointers as I’m able to.
As always, thanks for reading and passing this along to anyone that would find value from reading the Relational Technologist.
Please enjoy!

Make sure to subscribe so you don’t miss any of the future guides of working with Rust on the Raspberry Pi Pico as well as other exciting software engineering topics.
Hi Jim, rp-rs developer + maintainer here.
Thanks for the write-up, both for where things worked and where they didn't. We haven't had too much feedback on that, so it is most welcome!
Great to see a good step-by-step configuration options for OpenOCD - I haven't used it for debugging rp2040 but I know that a few have and had issues getting it set up correctly; we should really have some of this documentation as part of the project.
It's a bit late to help now (since you look to be done with this series) but I'd be interested in trying to work out why the probe / debug configuration from rp2040-app-template didn't work for you so that others don't have the same problems.
We spend most of our time in https://app.element.io/#/room/#rp-rs:matrix.org if you'd prefer a real-time group chat style conversation, or you could raise an issue on github on either rp2040-app-template or rp-hal - whichever works best for you.
This is an open invitation by the way - everyone is welcome in the matrix room, and issues / PRs for the repos most welcome.
Hey! Thank you for this series of post.
I was just playing around with some RP2040 controllers, and ended up with a slightly simpler setup (IMO). Instead of using a separate controller for handling the debug, I've just set up debug logging via USB serial port. This requires a bit more boilerplate (handling the USB interrupt and such), but is much simpler from the hardware perspective: you need to just plug in a single Pico board in your USB, flash it and you can immediately see the debug output.
Here's my repo: https://github.com/eterevsky/rp2040-blink